
The Basic rules of Stock Market Trading and Investing which are still useful even after more than 120 years of publishing formulated by Charles H. Dow, the Founder Editor of the Wall Street Journal and Co-Founder of Dow Jones and Company. We have presented theses rules with charts for better understanding
The Basic
rules of Stock Market Trading and Investing which are still useful even after more
than 120 years of publishing. Modern Day Analysts are now combining both the
Dow Theory and Candlesticks for better accuracy.
Whether you
are trading Short-Term, Positional, Long-Term, or even Futures and options,
this theory is useful.
Here are
the 6 Rules:
1. MARKET DISCOUNTS EVERYTHING
Charles Dow
says the Stock Price and Index Price reflect all news and information
available. The Dow Theory operates on Efficient Market Hypothesis where only
information which is still unknown is only excluded such as natural calamities.
But these events are priced in the form of risk. If they are not priced in,
market starts to respond to these news and information very early.
Here is the Sensex Chart (hourly) from 20-Feb-2020 to 23-Mar-2020, where Index was discounting Corona Virus fear and Index fell from 41300 to 26300 even before actual first wave started in India.

2.
THE THREE
TREND MARKET
Dow Theory
uses Trend Analysis to understand overall Market Movement. The Three trends
are:
i. Primary
Trend
The Primary
trend is the Most Important to be determined as this is the Major trend of the
Market or Stock. Charles Dow believed Primary Trend last anywhere from 1 year
to 3 year, but it may vary sometime. It can be an Uptrend, a Downtrend or a
sideways movement.
ii. Secondary
Trend
While the
Market tends to move in one Direction of Primary Trend, it doesn’t move in One
Straight Line. Within the Primary Trend
of Up move or Down move, we may get a Secondary Trend which is always in
opposite direction. So if the Primary Trend is of Up move, Secondary Trend
would be of Down move and if the Primary Trend is of Down move, Secondary Trend
would be of Up move. Secondary Trend lasts for 1 month to 3 months. This is
also called intermediate trend where Index moves in opposite director for
around 1/3rd to 2/3rd of the last primary trend move.
iii. Minor Trend
This
is fluctuation within the Primary Trend and Secondary Trend which last from
intraday price movement to less than 3 weeks. Dow Theorists rarely focus on
this trend as it may distract the traders and lead to irrational trading.
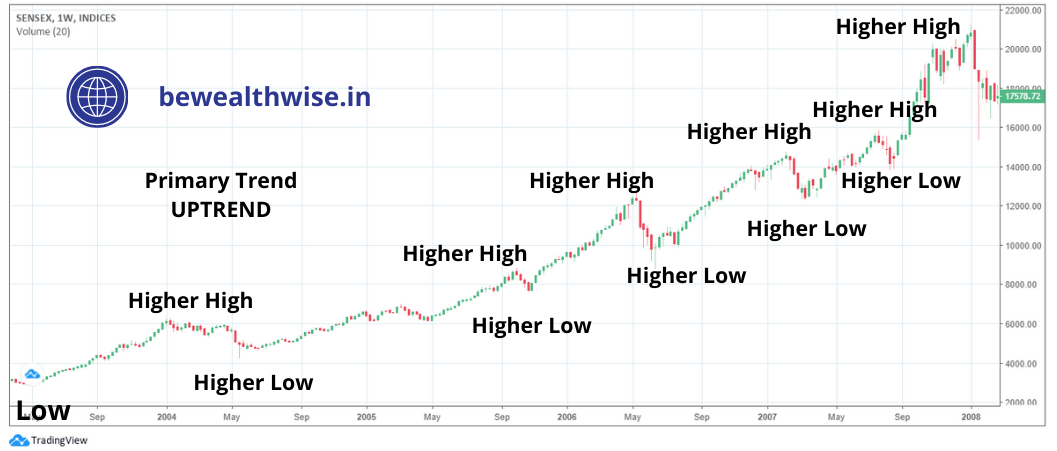
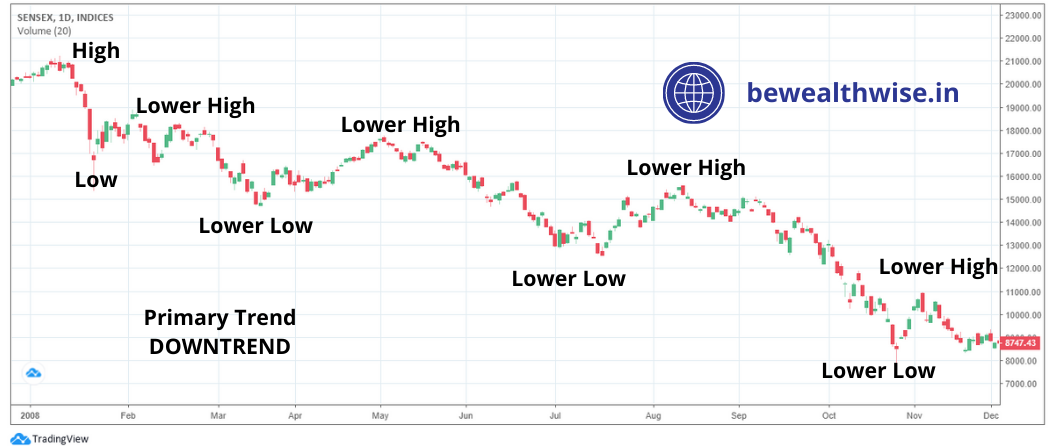
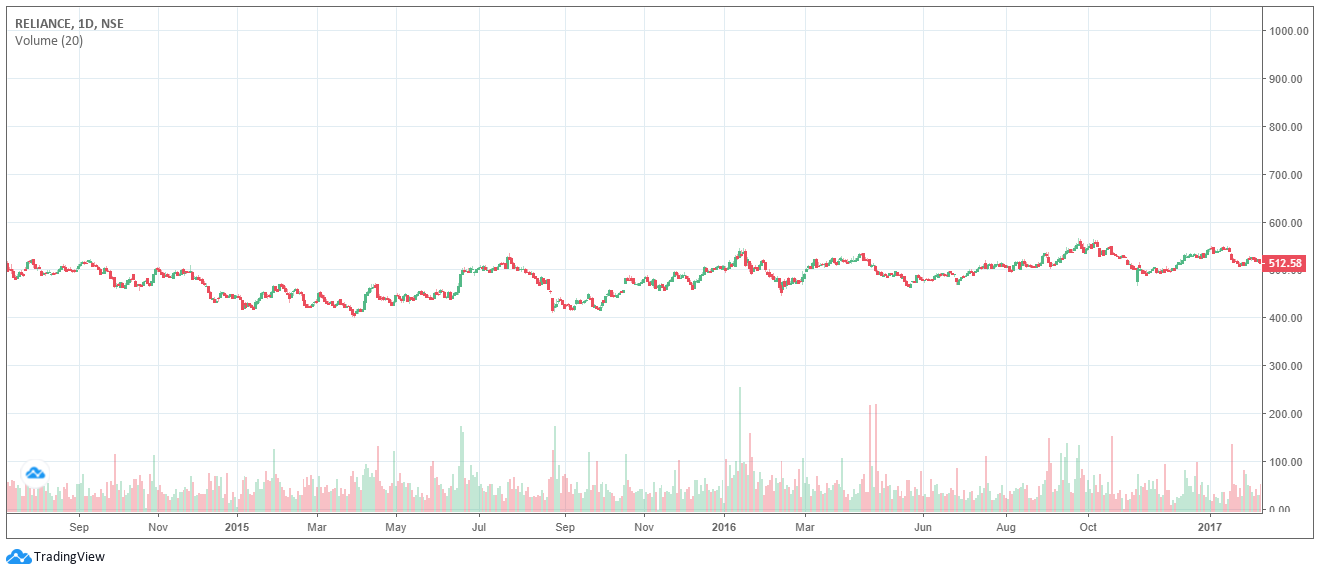
Here is
Three Charts of Uptrend (Sensex from 2003 to early 2008), Downtrend (Sensex
from early 2008 to early 2009) and sideways (Reliance Industries Limited from
Mid 2014 to early 2017), where all 3 trends, Primary, Secondary and minor are also
clearly visible.
3. THREE
PHASES OF PRIMARY TREND
Primary
Uptrend in a Bull Market has 3 Phases
i. Accumulation
This happens
right after a steep fall in the Index and the general mood of the Common people
is of pessimism and stocks are trading at an attractive valuation. This is the
time when acquainted investors starts buying the stocks.
ii. Participation
Once the
“Smart Money” buys huge quantity of stocks in first phase, short term trader
can sense a support and starts buying. With the increase participation from
many traders price tend to increase rapidly.
iii. Euphoria
When
everyone starts talking about stocks and even junk stocks start hitting 52-Week
high, euphoria builds. This is the time when the “Smart Money” which bought at
the accumulation phase starts booking their profit in distribution pattern.
Here is the Chart from early 2002 to 2008 of complete Bull market:
_1608968453op7HS.png)
Primary
Uptrend in a Bear Market has 3 Phases
i. Distribution
The Last
phase of Bull market is the first phase of Bear Market; where markets are may
be still going up, but the smart money starts selling their earlier trades of
bull market.
ii. Participation
Once the
“Smart Money” sells huge quantity of stocks in first phase, liquidity in the
market rapidly reduces. Sentiment starts going down as the time goes by and
market discount even further weakness.
iii. Panic
The last
phase where buying dries, margin calls start triggering and nobody wants to
touch the stock again. This is when people panic; index sees deep cuts and
sometimes selling freezes.
Here is the
Chart from early 2008 to Mid 2009 of complete Bear market:
_1608968477nT4Kt.png)
4. THE INDICES MUST CONFIRM EACH OTHER:
According
to Charles Dow, every index should move in similar direction to establish a
Primary Trend. So if someone is Bullish on ‘Sensex’, trend cannot be
established based on that one Index only, rather all other indices should also
confirm the trend. Similarly, if someone is bullish on Real Estate Stocks, they
must all be bullish on Cement, Steel and other related stocks.
5. VOLUMES MUST CONFIRM THE TREND
There are 4
possibilities for price and volume combination:
Price goes
up with volume also going up
Price goes up
without volume going up
Price goes
down with volume going up
Price goes
down without volume going up
Charles
believed that the volumes must go up for deciding the trend; hence, if Price
goes up with volume also going up; it is signalling a Bull Market. In the same
way, Price goes down with volume goes up; it is signalling a Bear Market. If
many participants are active, the volume is supposed to be high and price is
also supposed to move in that direction.
When Price
goes up without volume going up, it is just because of some over aggressive
buyers and when Price goes down without volume going up, it is just because of
some over aggressive sellers.
6. TREND REMAINS UNTIL PROVED OTHERWISE
Within the same trend, say primary trend uptrend, we may some reversals, which are Secondary trend-where price contrast 1/3rd to 2/3rd of previous move. However, Charles said, price will soon resume to its primary trend until it is proved that trend has changed. Determining if the trend has changed or not is not easy and many analysts disagree with each other while deciding so.
And that’s why and that’s how market functions !
Leave a comment